Note
Go to the end to download the full example code.
Asymmetric Directional Resolution
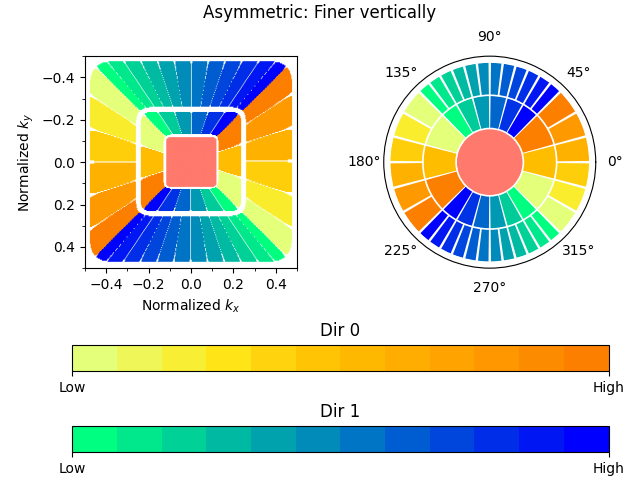
One of the features of the UDCT is that it is able to specify different resolutions for different quadrants of the Fourier space. This allows one to target finer details with more division, and coarser scales with fewer.
# sphinx_gallery_thumbnail_number = 2

from __future__ import annotations

from typing import Literal

import matplotlib.pyplot as plt
import numpy as np
import numpy.typing as npt
from matplotlib import ticker
from matplotlib.axes import Axes
from matplotlib.cm import ScalarMappable
from matplotlib.colorbar import ColorbarBase
from matplotlib.colors import Normalize, to_rgba
from matplotlib.gridspec import GridSpec
from matplotlib.typing import ColorType
from numpy.fft import fftfreq, fftshift

from curvelets.numpy import UDCT, SparseWindow
Symmetric and Asymmetric UDCTs
Plotting Functions
Created Colored image from Windows
def color_windows(
    C: UDCT,
    thresh: float = 0.8,
    cmaps_dir: tuple[str, str] = ("Wistia", "winter_r"),
    color_low: ColorType = "w",
    color_bg: ColorType = (0, 0, 0, 1),
) -> npt.NDArray[np.floating]:
    wins = C.windows

    def create_mask(wedge: SparseWindow) -> npt.NDArray[np.bool_]:
        wedge_dense = wedge.to_dense()
        wedge_dense = fftshift(wedge_dense)
        return (wedge_dense >= thresh).astype(np.bool_)

    def assign_rgba_to_mask(
        mask_index: npt.NDArray[np.bool_] | None,
        mask_target: npt.NDArray[np.floating],
        rgb_a: tuple[float, ...],
    ) -> None:
        if mask_index is None:
            mask_target[..., 0] = rgb_a[0]
            mask_target[..., 1] = rgb_a[1]
            mask_target[..., 2] = rgb_a[2]
            if len(rgb_a) > 3:
                mask_target[..., 3] = rgb_a[3]
        else:
            mask_target[..., 0][mask_index] = rgb_a[0]
            mask_target[..., 1][mask_index] = rgb_a[1]
            mask_target[..., 2][mask_index] = rgb_a[2]
            if len(rgb_a) > 3:
                mask_target[..., 3][mask_index] = rgb_a[3]

    # Scale 0 wedge
    mask = create_mask(wins[0][0][0])

    # Full colored mask
    rgb_a_bg: tuple[float, float, float, float] = to_rgba(color_bg)
    mask_rgba = np.zeros((*mask.shape, 4), dtype=float)
    assign_rgba_to_mask(None, mask_rgba, rgb_a_bg)

    # Set scale 0 wedges in full mask
    rgb_a_low: tuple[float, float, float, float] = to_rgba(color_low)
    assign_rgba_to_mask(mask, mask_rgba, rgb_a_low)

    # Rest of scales
    for iscale in range(1, len(wins)):
        ndir = len(wins[iscale])
        assert ndir == 2
        for idir in range(ndir):
            nwedges = len(wins[iscale][idir])

            cmap = plt.get_cmap(cmaps_dir[idir])
            norm = Normalize(vmin=0, vmax=nwedges - 1)
            scalarMap = ScalarMappable(norm=norm, cmap=cmap)

            for iwedge in range(nwedges):
                mask = create_mask(wins[iscale][idir][iwedge])
                mask = mask | np.flip(mask, axis=(0, 1))
                rgb_a_wedge: tuple[float, float, float, float] = scalarMap.to_rgba(
                    np.array([iwedge])
                )[0]
                assign_rgba_to_mask(mask, mask_rgba, rgb_a_wedge)
    return mask_rgba
Created Disk from Windows
def plot_disk(
    C: UDCT,
    ax: Axes,
    cmaps_dir: tuple[str, str] = ("Wistia", "winter_r"),
    color_low: ColorType = "w",
    color_bg: ColorType = (0, 0, 0, 1),
) -> None:
    deg_360 = 2 * np.pi
    deg_45 = np.pi / 4
    deg_225 = np.pi * 5 / 4
    deg_90 = np.pi / 2

    ax.yaxis.set_visible(False)
    ax.grid(False)
    ax.set_facecolor(color_bg)

    nscales = len(C.windows)
    wedge_height = 1 / (nscales - 1)
    ax.bar(x=0, height=wedge_height, width=deg_360, bottom=0, color=color_low)
    for iscale, s in enumerate(C.windows[1:], start=1):
        ndir = len(s)
        assert ndir == 2
        for idir, d in enumerate(s):
            nwedges = len(d)
            angles_per_wedge = deg_90 / nwedges
            pm = -((-1) ** idir)  # Clockwise (-1) for idir == 0, CCW (+1) for idir == 1
            cmap = plt.get_cmap(cmaps_dir[idir])
            norm = Normalize(vmin=0, vmax=nwedges - 1)
            scalarMap = ScalarMappable(norm=norm, cmap=cmap)
            for iwedge in range(nwedges):
                color: tuple[float, float, float, float] = scalarMap.to_rgba(
                    np.array([iwedge])
                )[0]
                for offset in [deg_45, deg_225]:  # top-right, bottom-left
                    wedge_x = offset + pm * angles_per_wedge * (0.5 + iwedge)
                    wedge_width = angles_per_wedge
                    wedge_bottom = iscale * wedge_height
                    ax.bar(
                        x=wedge_x,
                        height=wedge_height,
                        width=wedge_width,
                        bottom=wedge_bottom,
                        color=color,
                    )

    linewidth = 0.05 * wedge_height
    linecolor = color_bg
    # Plot after so they are on top
    for iscale, s in enumerate(C.windows):
        # Scale separators
        ax.bar(
            x=0,
            height=linewidth,
            width=deg_360,
            bottom=(iscale + 1 - linewidth / 2) / (nscales - 1),
            color=linecolor,
        )
        if iscale == 0:
            continue
        # Wedge separators
        for idir, d in enumerate(s):
            nwedges = len(d)
            angles_per_wedge = deg_90 / nwedges
            pm = -((-1) ** idir)
            for iwedge in range(nwedges):
                for offset in [deg_45, deg_225]:  # top-right, bottom-left
                    wedge_x = offset + pm * angles_per_wedge * (0.5 + iwedge)
                    wedge_width = angles_per_wedge
                    wedge_bottom = iscale * wedge_height
                    ax.bar(
                        x=wedge_x - wedge_width / 2,
                        height=wedge_height,
                        width=linewidth,
                        bottom=wedge_bottom,
                        color=linecolor,
                    )
Create Colorbars for Directions
def plot_colorbars(
    windows: list[list[list[SparseWindow]]],
    axs: list[Axes],
    cmaps: tuple[str, str] = ("Wistia", "winter_r"),
    orientation: Literal["horizontal", "vertical"] = "horizontal",
) -> None:
    for idir, cax in enumerate(axs):
        max_wedges = max(len(d) for s in windows for d in s)
        cmap = plt.get_cmap(cmaps[idir], max_wedges)
        ColorbarBase(cax, cmap=cmap, orientation=orientation)
        xyaxis = cax.yaxis if orientation == "vertical" else cax.xaxis
        xyaxis.set_major_locator(ticker.MultipleLocator(1))
        xyaxis.set_major_formatter(
            ticker.FuncFormatter(
                lambda x, _: "Low" if int(round(2 * x)) == 0 else "High"
            )
        )
        cax.set_title(f"Dir {idir}")
Plot Support of UDCTs in the Fourier Domain
Symmetric
title = "Symmetric"
C = C_sym
colored_wins = color_windows(C, cmaps_dir=cmaps, color_low=color_low, color_bg=color_bg)

fig = plt.figure(layout="constrained")
fig.suptitle(title)
gs = GridSpec(3, 2, figure=fig, height_ratios=[8, 1, 1])
ax1 = fig.add_subplot(gs[0, 0])
ax2 = fig.add_subplot(gs[0, 1], projection="polar")
ax3 = fig.add_subplot(gs[1, :])
ax4 = fig.add_subplot(gs[2, :])
ax1.imshow(
    colored_wins.swapaxes(0, 1), extent=(kx[0], kx[-1], ky[-1], ky[0]), aspect=ny / nx
)
ax1.xaxis.set_minor_locator(ticker.MultipleLocator(0.1))
ax1.yaxis.set_minor_locator(ticker.MultipleLocator(0.1))
ax1.set(
    xlim=[kx[0], -kx[0]],
    ylim=[-ky[0], ky[0]],
    xlabel="Normalized $k_x$",
    ylabel="Normalized $k_y$",
)
plot_colorbars(C.windows, [ax3, ax4], cmaps=cmaps)
plot_disk(C, ax2, cmaps_dir=cmaps, color_low=color_low, color_bg=color_bg)

Asymmetric: Finer horizontally
title = "Asymmetric: Finer horizontally"
C = C_asymh
colored_wins = color_windows(C, cmaps_dir=cmaps, color_low=color_low, color_bg=color_bg)

fig = plt.figure(layout="constrained")
fig.suptitle(title)
gs = GridSpec(3, 2, figure=fig, height_ratios=[8, 1, 1])
ax1 = fig.add_subplot(gs[0, 0])
ax2 = fig.add_subplot(gs[0, 1], projection="polar")
ax3 = fig.add_subplot(gs[1, :])
ax4 = fig.add_subplot(gs[2, :])
ax1.imshow(colored_wins.swapaxes(0, 1), extent=(kx[0], kx[-1], ky[-1], ky[0]))
ax1.xaxis.set_minor_locator(ticker.MultipleLocator(0.1))
ax1.yaxis.set_minor_locator(ticker.MultipleLocator(0.1))
ax1.set(
    xlim=[kx[0], -kx[0]],
    ylim=[-ky[0], ky[0]],
    xlabel="Normalized $k_x$",
    ylabel="Normalized $k_y$",
)
plot_colorbars(C.windows, [ax3, ax4], cmaps=cmaps)
plot_disk(C, ax2, cmaps_dir=cmaps, color_low=color_low, color_bg=color_bg)

Asymmetric: Finer vertically
title = "Asymmetric: Finer vertically"
C = C_asymv
colored_wins = color_windows(C, cmaps_dir=cmaps, color_low=color_low, color_bg=color_bg)

fig = plt.figure(layout="constrained")
fig.suptitle(title)
gs = GridSpec(3, 2, figure=fig, height_ratios=[8, 1, 1])
ax1 = fig.add_subplot(gs[0, 0])
ax2 = fig.add_subplot(gs[0, 1], projection="polar")
ax3 = fig.add_subplot(gs[1, :])
ax4 = fig.add_subplot(gs[2, :])
ax1.imshow(colored_wins.swapaxes(0, 1), extent=(kx[0], kx[-1], ky[-1], ky[0]))
ax1.xaxis.set_minor_locator(ticker.MultipleLocator(0.1))
ax1.yaxis.set_minor_locator(ticker.MultipleLocator(0.1))
ax1.set(
    xlim=[kx[0], -kx[0]],
    ylim=[-ky[0], ky[0]],
    xlabel="Normalized $k_x$",
    ylabel="Normalized $k_y$",
)
plot_colorbars(C.windows, [ax3, ax4], cmaps=cmaps)
plot_disk(C, ax2, cmaps_dir=cmaps, color_low=color_low, color_bg=color_bg)
Total running time of the script: (0 minutes 1.535 seconds)