Note
Go to the end to download the full example code.
Curvelet-based Denoising
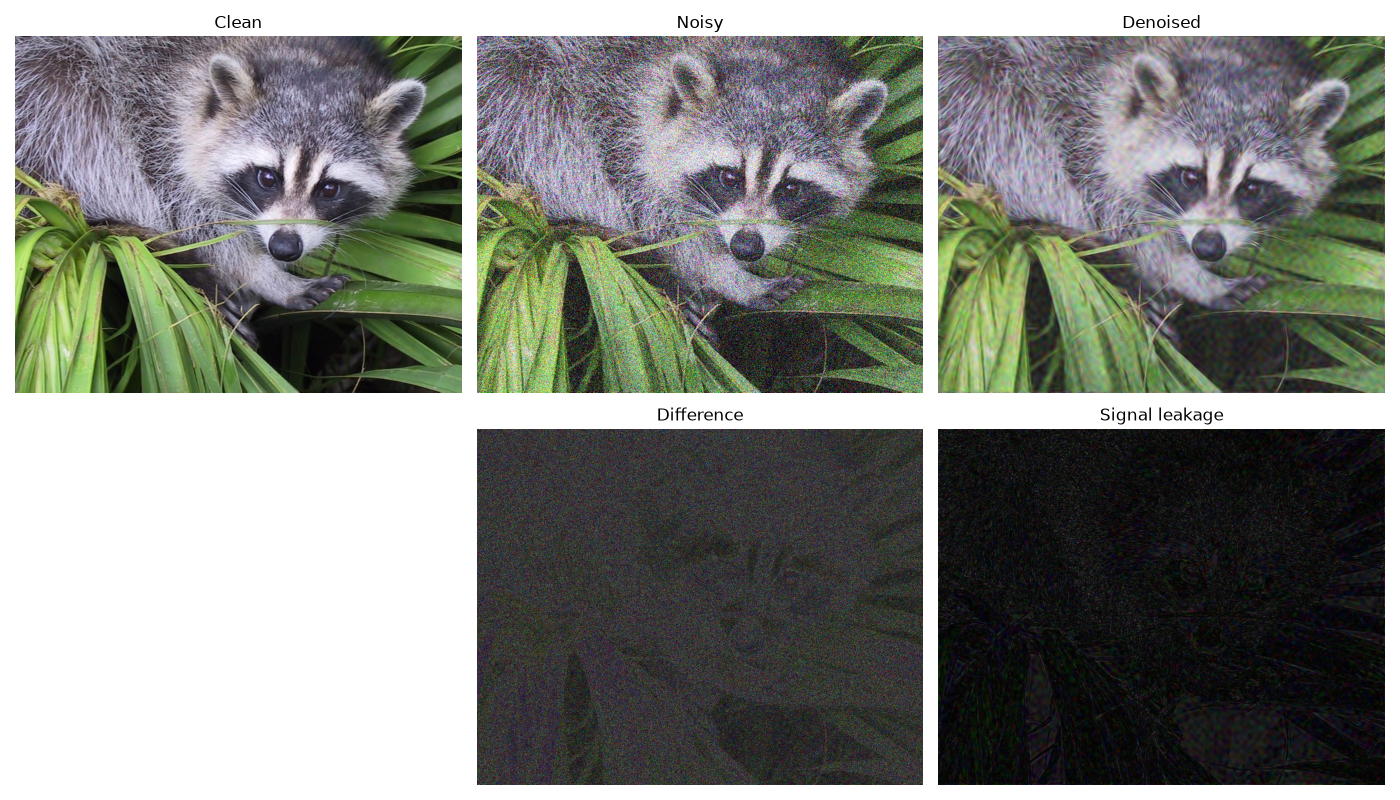
This example shows how the UDCT curvelets transform can be used to denoise images. More precisely, an the curvelet transform of a natual image tends to have strong, localized coefficients; on the other hand, the UDCT transform of a (white Gaussian) noise realization does not map into anything really consistent in the curvelets domain. As such if we take the UDCT transform of a noisy image and apply a suitable thresholding (e.g., by retaining a given percentage of the coefficients sorted in decreasing order), the inverse UDCT transform produces a denoised version of the input image.
from __future__ import annotations
import matplotlib.pyplot as plt
import numpy as np
import numpy.typing as npt
import scipy as sp

from curvelets.numpy import UDCT
Denoising by thresholding
Define function that extracts indices of the strongest coefficients to retain for thresholding in the UDCT transform
def udct_threshold_indices(
    cwt_vect: npt.NDArray[np.complex64], perc: float
) -> npt.NDArray[np.intp]:
    """
    Extract linear indices of coefficients to keep based on threshold percentage.

    Parameters
    ----------
    cwt_vect : numpy.ndarray
        UDCT coefficients (vectorized version)
    perc : float
        Percentage of coefficients being retained

    Returns
    -------
    idxs : numpy.ndarray
        Linear indices of the strongest coefficients to retain
    """
    n = round(cwt_vect.size * perc)
    return np.argsort(np.abs(cwt_vect.ravel()))[::-1][:n]
Noisy image
Create noisy image by adding a realization of white Gaussian noise to a natural image
# Load image
dorig = sp.datasets.face()
dorig = dorig / dorig.max()

# Add noise to image
rng = np.random.default_rng(seed=0)
d = np.clip(dorig + rng.normal(0, 3e-1, dorig.shape), 0, 1)
Downloading file 'face.dat' from 'https://raw.githubusercontent.com/scipy/dataset-face/main/face.dat' to '/home/docs/.cache/scipy-data'.
Denoising
Apply denoising by thresholding in the UDCT domain. The threshold is determined from a grayscale version of the image, and the same filter is applied to all RGB channels to preserve color relationships.
# Defined UDCT transform
Cop = UDCT(shape=d.shape[:2], num_scales=4, transform_kind="real")

# Convert noisy image to grayscale using standard luminance weights
d_gray = 0.299 * d[..., 0] + 0.587 * d[..., 1] + 0.114 * d[..., 2]

# Compute threshold indices from grayscale image
perc = 0.04
cwt_gray = Cop.vect(Cop.forward(d_gray))
thresh_idxs = udct_threshold_indices(cwt_gray, perc)

# Apply the same threshold filter to each RGB channel
d_cwts = []
for i in range(3):
    cwt = Cop.vect(Cop.forward(d[..., i]))
    cwt_thresh = np.zeros_like(cwt)
    cwt_thresh[thresh_idxs] = cwt[thresh_idxs]
    d_cwt_raw = Cop.backward(Cop.struct(cwt_thresh))
    d_cwts.append(np.clip(d_cwt_raw, 0, 1))
d_cwt = np.stack(d_cwts, axis=-1)
Correlation between noisy and clean: 59.7%
Correlation between denoised and clean: 95.5%
fig, axs = plt.subplots(2, 3, figsize=(14, 8), sharey=True, sharex=True)
axs[0, 0].imshow(dorig)
axs[0, 0].set_title("Clean")
axs[0, 1].imshow(d)
axs[0, 1].set_title("Noisy")
axs[0, 2].imshow(d_cwt)
axs[0, 2].set_title("Denoised")
axs[1, 0].axis("off")
axs[1, 1].imshow(np.abs(d - d_cwt))
axs[1, 1].set_title("Difference")
axs[1, 2].imshow(np.abs(dorig - d_cwt))
axs[1, 2].set_title("Signal leakage")
for ax in axs.ravel():
    ax.axis("off")
    ax.axis("tight")
fig.tight_layout()
Total running time of the script: (0 minutes 6.730 seconds)