Note
Go to the end to download the full example code.
Zone Plate
# sphinx_gallery_thumbnail_number = 2

from __future__ import annotations
import matplotlib.pyplot as plt
import numpy as np
from matplotlib import ticker

from curvelets.numpy import UDCT
from curvelets.plot import create_colorbar, despine
from curvelets.utils import make_zone_plate
Setup
Uniform Discrete Curvelet Transform Round Trip
coeffs = C.forward(zone_plate)
zone_plate_inv = C.backward(coeffs)
vmax = np.abs(zone_plate).max()
opts = {"aspect": "equal", "cmap": "gray", "vmin": -vmax, "vmax": vmax}
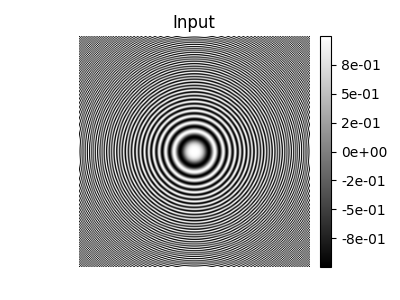
fig, ax = plt.subplots(figsize=(4, 3))
im = ax.imshow(zone_plate.T, **opts)
_, cb = create_colorbar(im=im, ax=ax)
fmt = ticker.FuncFormatter(lambda x, _: f"{x:.0e}")
cb.ax.yaxis.set_major_formatter(fmt)
despine(ax)
ax.set(title="Input")
[Text(0.5, 1.0, 'Input')]
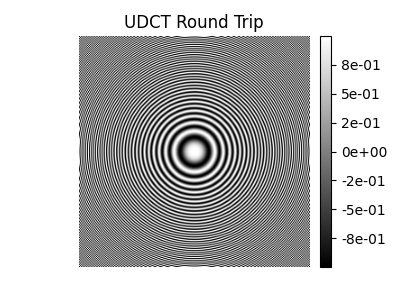
[Text(0.5, 1.0, 'UDCT Round Trip')]
opts["vmax"] = np.abs(zone_plate - zone_plate_inv).max()
opts["vmin"] = -opts["vmax"]
fig, ax = plt.subplots(figsize=(4, 3))
im = ax.imshow((zone_plate - zone_plate_inv).T, **opts)
_, cb = create_colorbar(im=im, ax=ax)
cb.ax.yaxis.set_major_formatter(fmt)
despine(ax)
ax.set(title=f"Error (max = {opts['vmax']:.2g})")

print(f"Max Error: {opts['vmax']:.2g}")  # noqa: T201
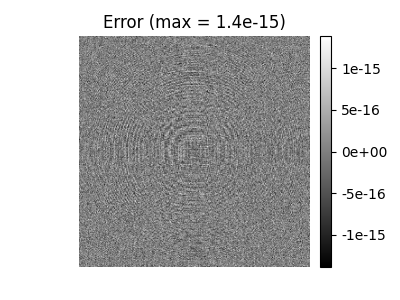
Max Error: 1.4e-15
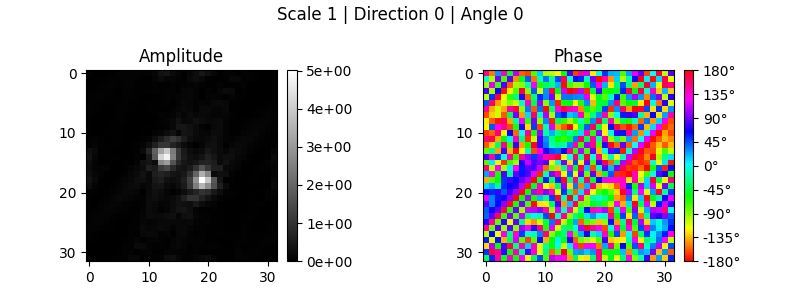
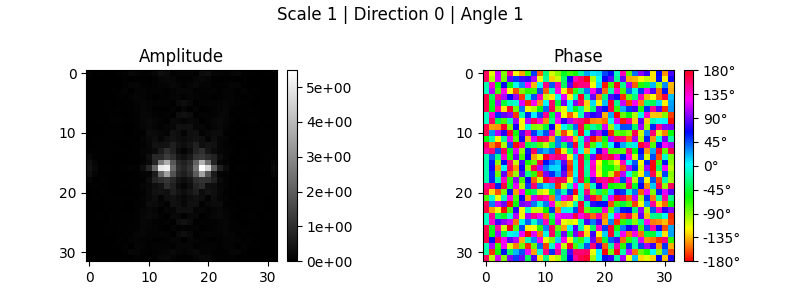
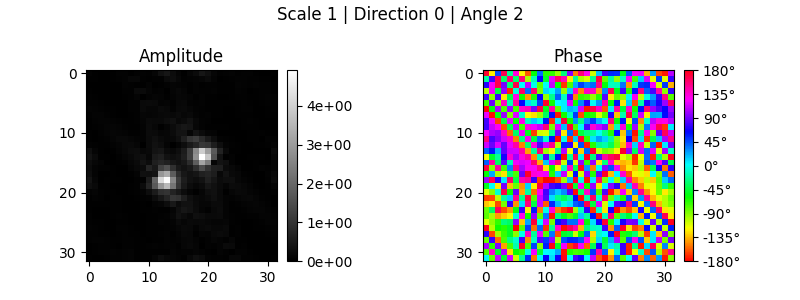
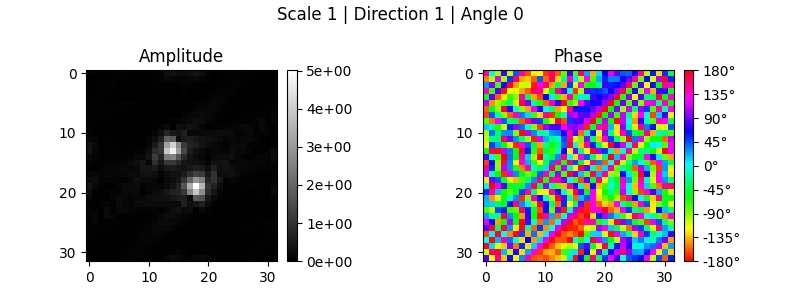
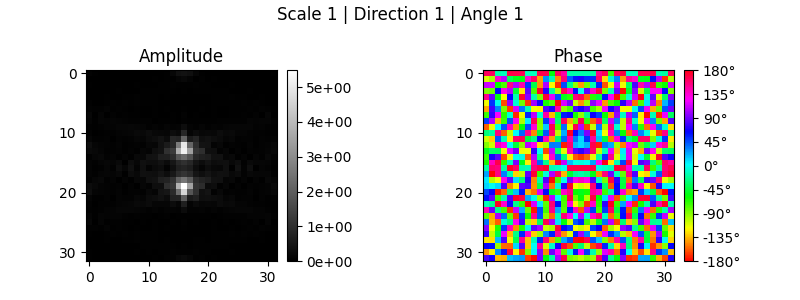
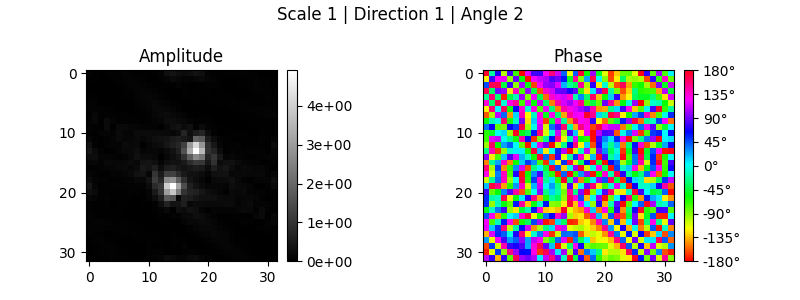
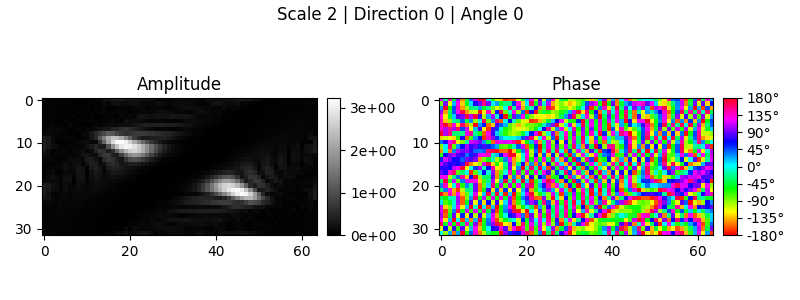
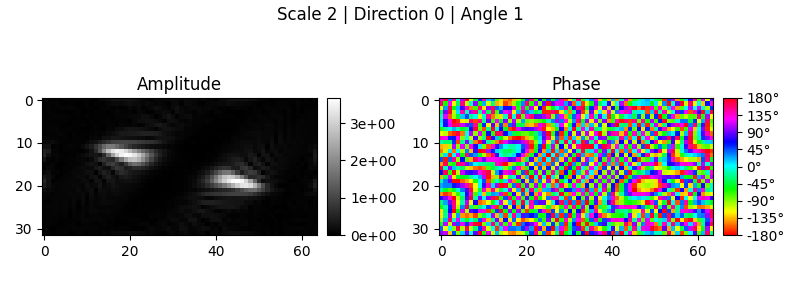
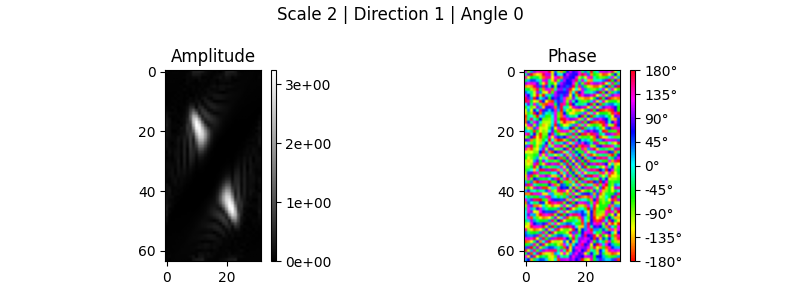
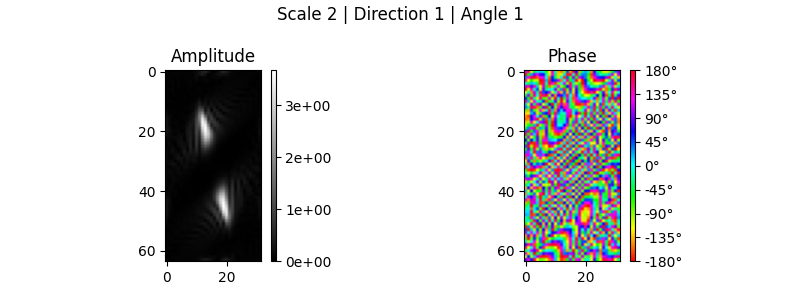
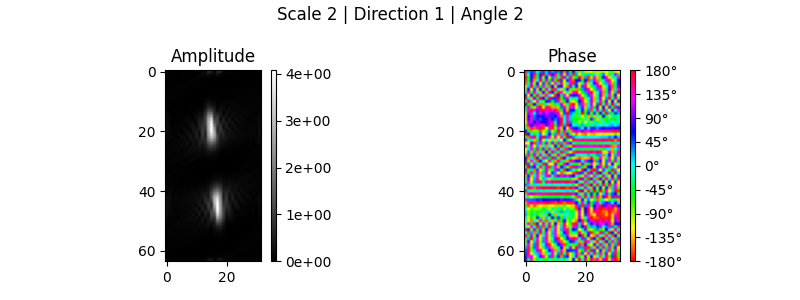
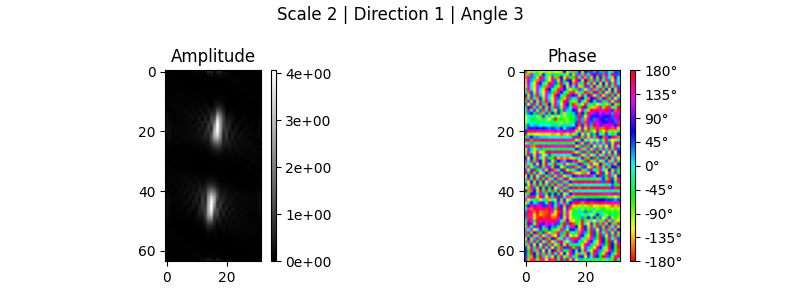
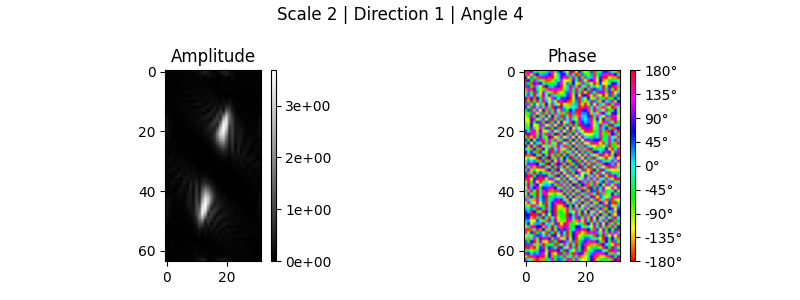
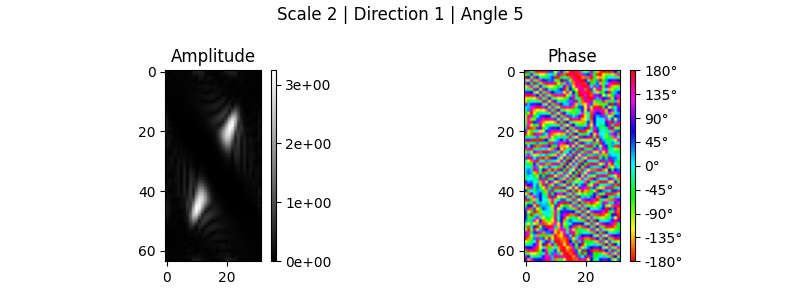
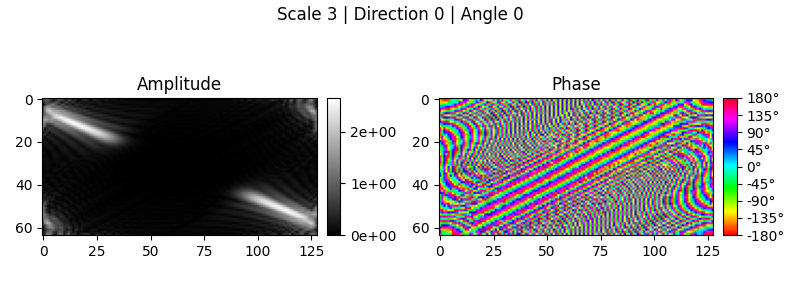
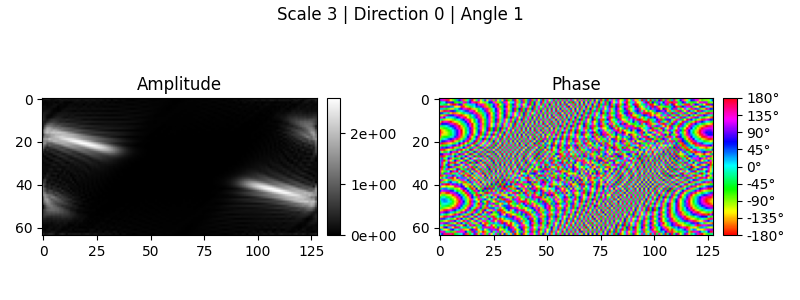
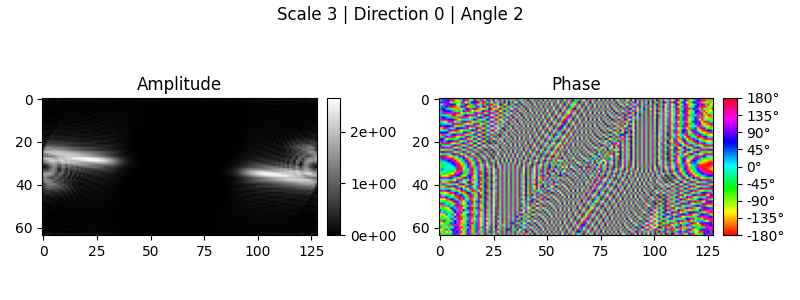
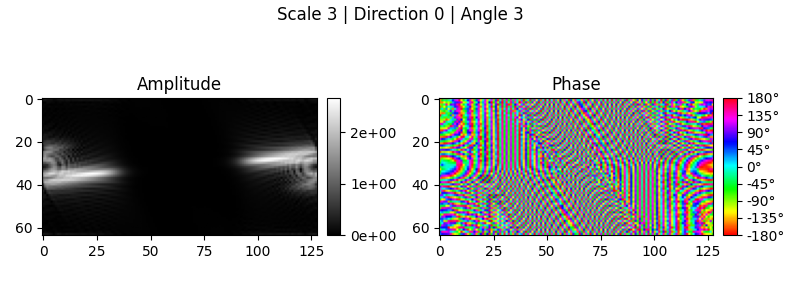
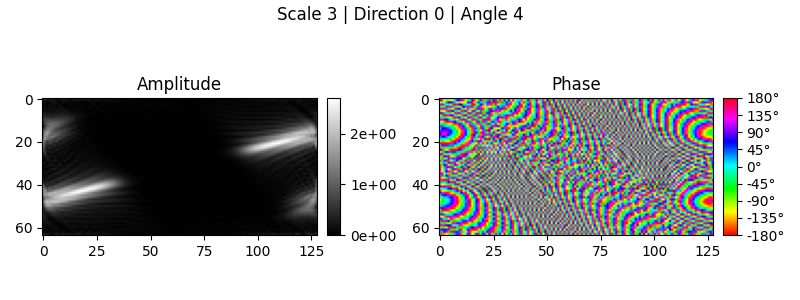
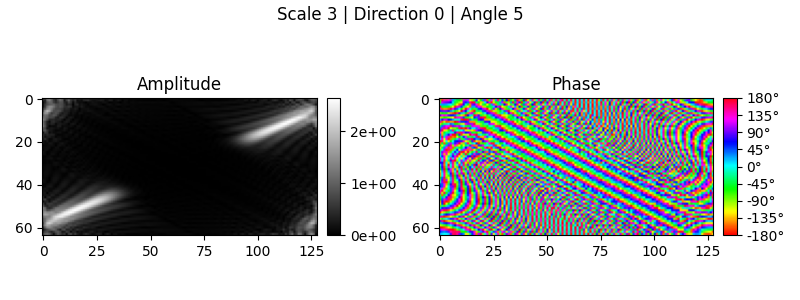
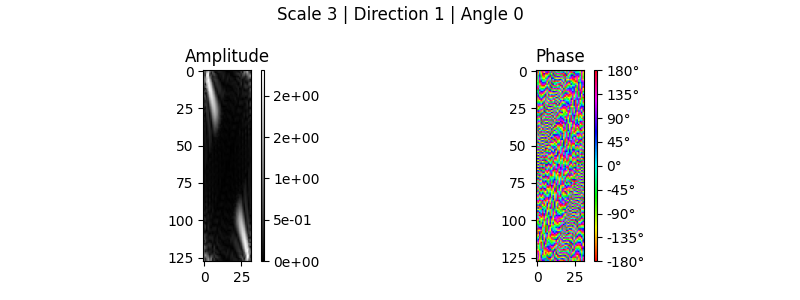
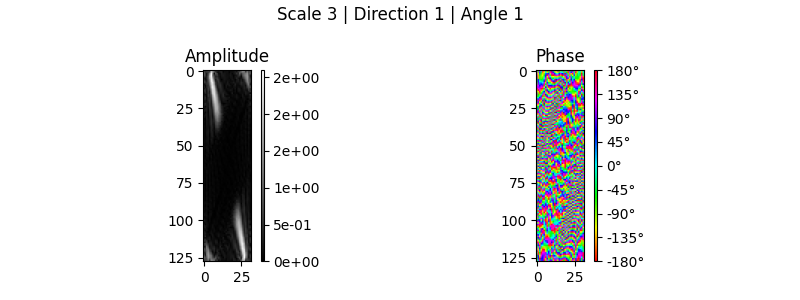
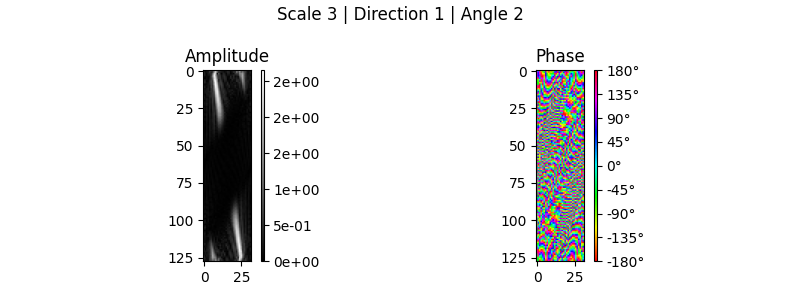
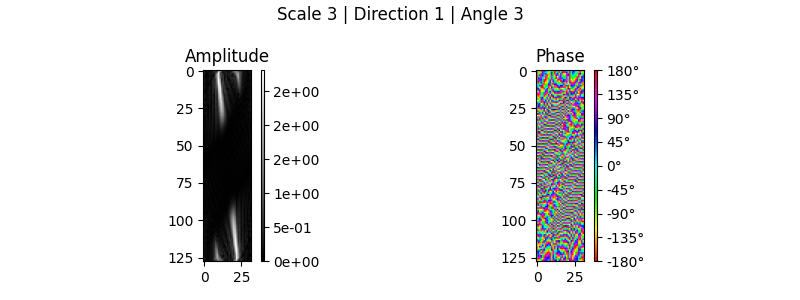
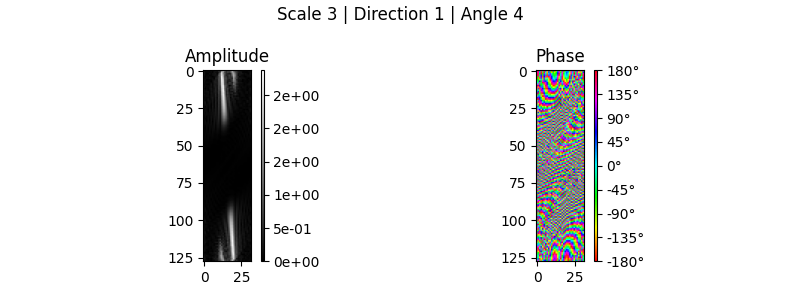
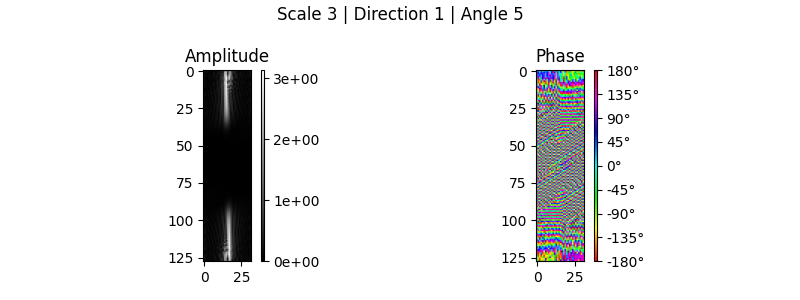
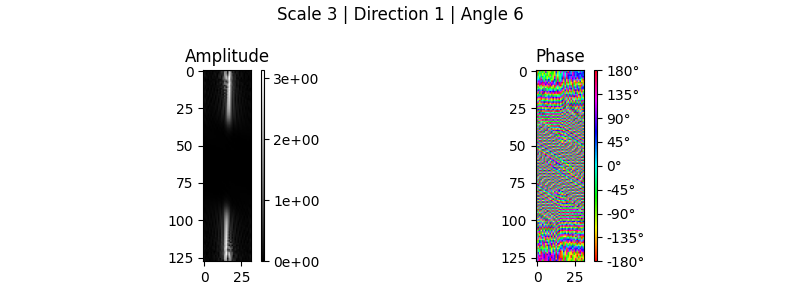
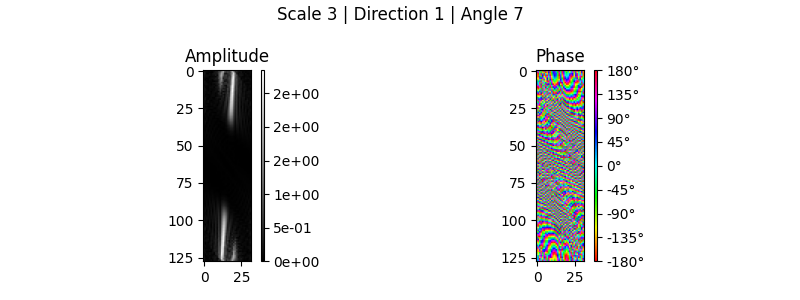
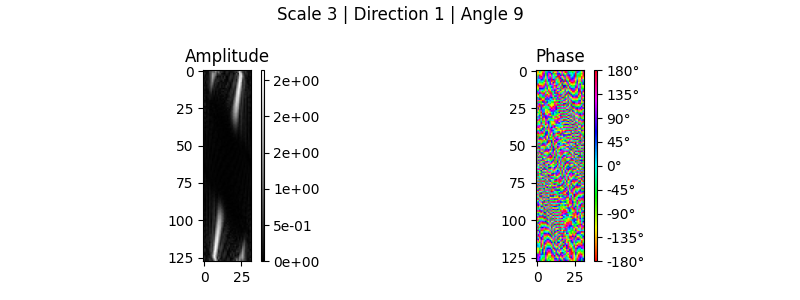
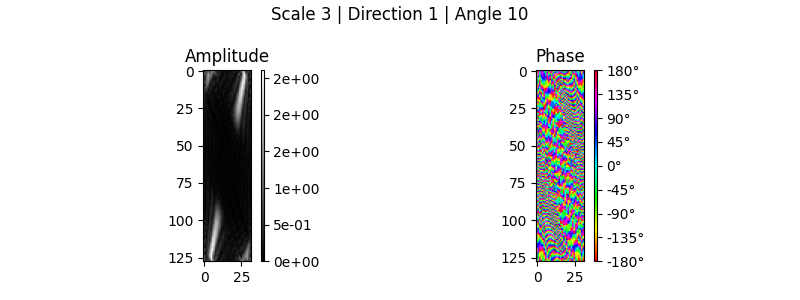
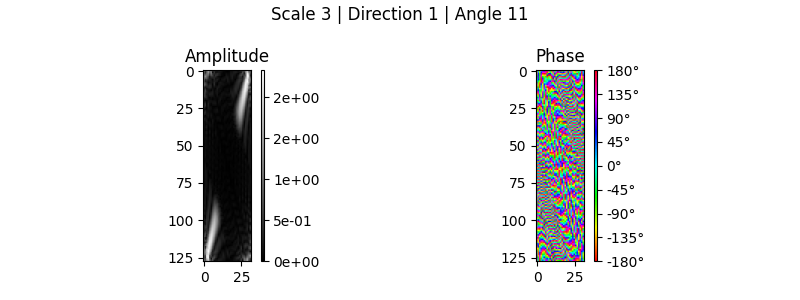
Curvelet Coefficients: Amplitude and Phase
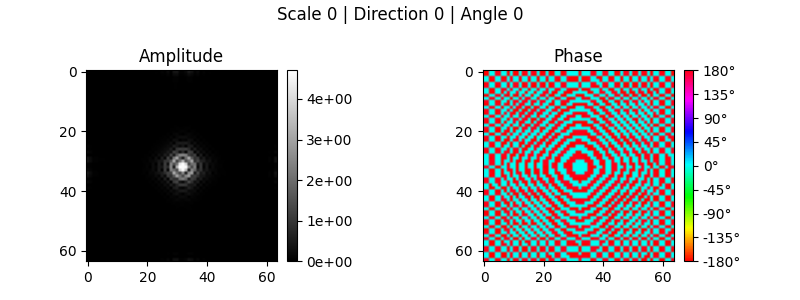
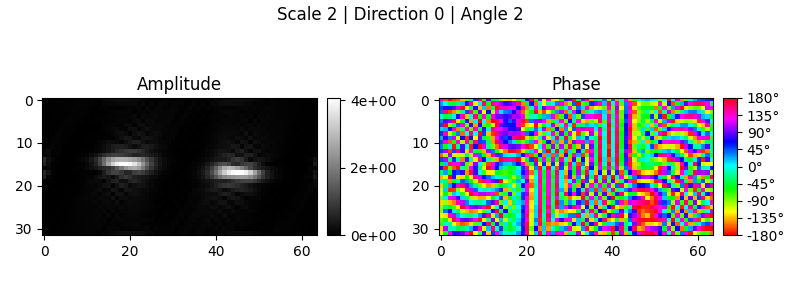
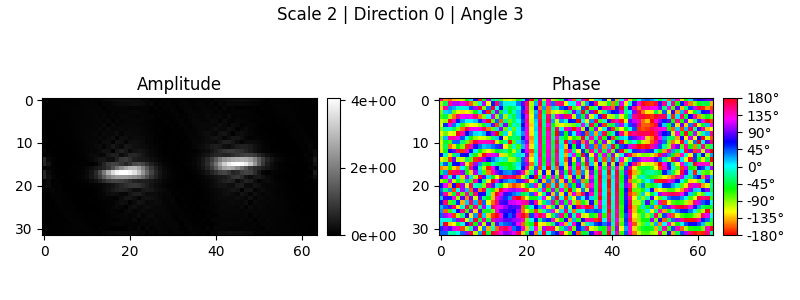
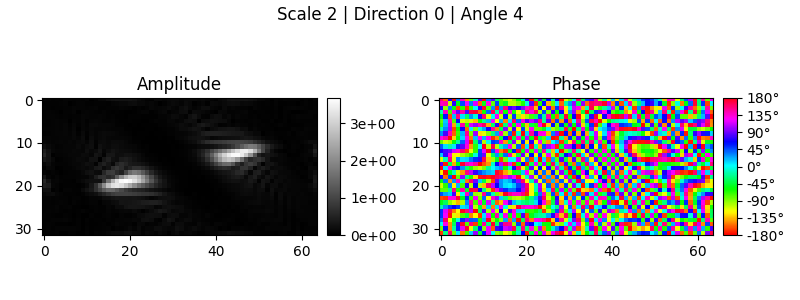
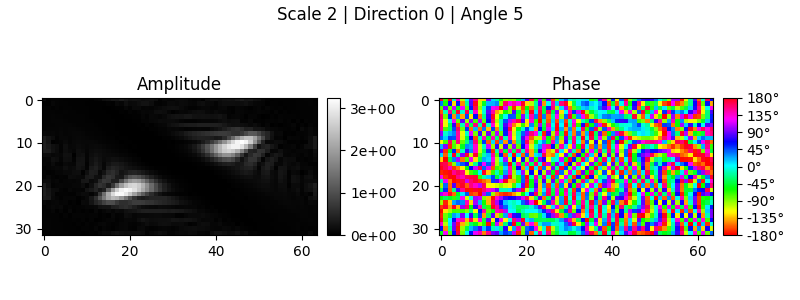
for ires, _ in enumerate(coeffs):
    for idir, _ in enumerate(coeffs[ires]):
        for iang, _ in enumerate(coeffs[ires][idir]):
            z = coeffs[ires][idir][iang]
            opts["vmax"] = np.abs(z).max()
            opts["vmin"] = 0
            opts["cmap"] = "gray"
            fig, axs = plt.subplots(1, 2, figsize=(8, 3))
            im = axs[0].imshow(np.abs(z).T, **opts)
            _, cb = create_colorbar(im=im, ax=axs[0])
            fmt = ticker.FuncFormatter(lambda x, _: f"{x:.0e}")
            cb.ax.yaxis.set_major_formatter(fmt)
            opts["vmax"] = 180
            opts["vmin"] = -opts["vmax"]
            opts["cmap"] = "hsv"
            im = axs[1].imshow(np.angle(z, deg=True).T, **opts)
            _, cb = create_colorbar(im=im, ax=axs[1])
            cb.ax.yaxis.set_major_locator(ticker.MultipleLocator(45))
            cb.ax.yaxis.set_major_formatter(lambda x, _: f"{x:.0f}°")
            axs[0].set(title="Amplitude")
            axs[1].set(title="Phase")
            fig.suptitle(f"Scale {ires} | Direction {idir} | Angle {iang}")
            fig.tight_layout()


# # %%
# # Curvelet Coefficients: Real and Imaginary
# # #########################################
# opts["cmap"] = "gray"
# for ires, _ in enumerate(coeffs):
#     for idir, _ in enumerate(coeffs[ires]):
#         for iang, _ in enumerate(coeffs[ires][idir]):
#             z = coeffs[ires][idir][iang]
#             opts["vmax"] = np.abs(z).max()
#             opts["vmin"] = -opts["vmax"]
#             fig, axs = plt.subplots(1, 2, figsize=(8, 3))
#             for ax, img in zip(axs.ravel(), [z.real, z.imag]):
#                 im = ax.imshow(img.T, **opts)
#                 _, cb = create_colorbar(im=im, ax=ax)
#                 fmt = ticker.FuncFormatter(lambda x, _: f"{x:.0e}")
#                 cb.ax.yaxis.set_major_formatter(fmt)
#             axs[0].set(title="Real")
#             axs[1].set(title="Imaginary")
#             fig.suptitle(f"Scale {ires} | Direction {idir} | Angle {iang}")
#             fig.tight_layout()

/home/docs/checkouts/readthedocs.org/user_builds/curvelets/checkouts/stable/examples/plot_01_zone_plate.py:77: RuntimeWarning: More than 20 figures have been opened. Figures created through the pyplot interface (`matplotlib.pyplot.figure`) are retained until explicitly closed and may consume too much memory. (To control this warning, see the rcParam `figure.max_open_warning`). Consider using `matplotlib.pyplot.close()`.
  fig, axs = plt.subplots(1, 2, figsize=(8, 3))
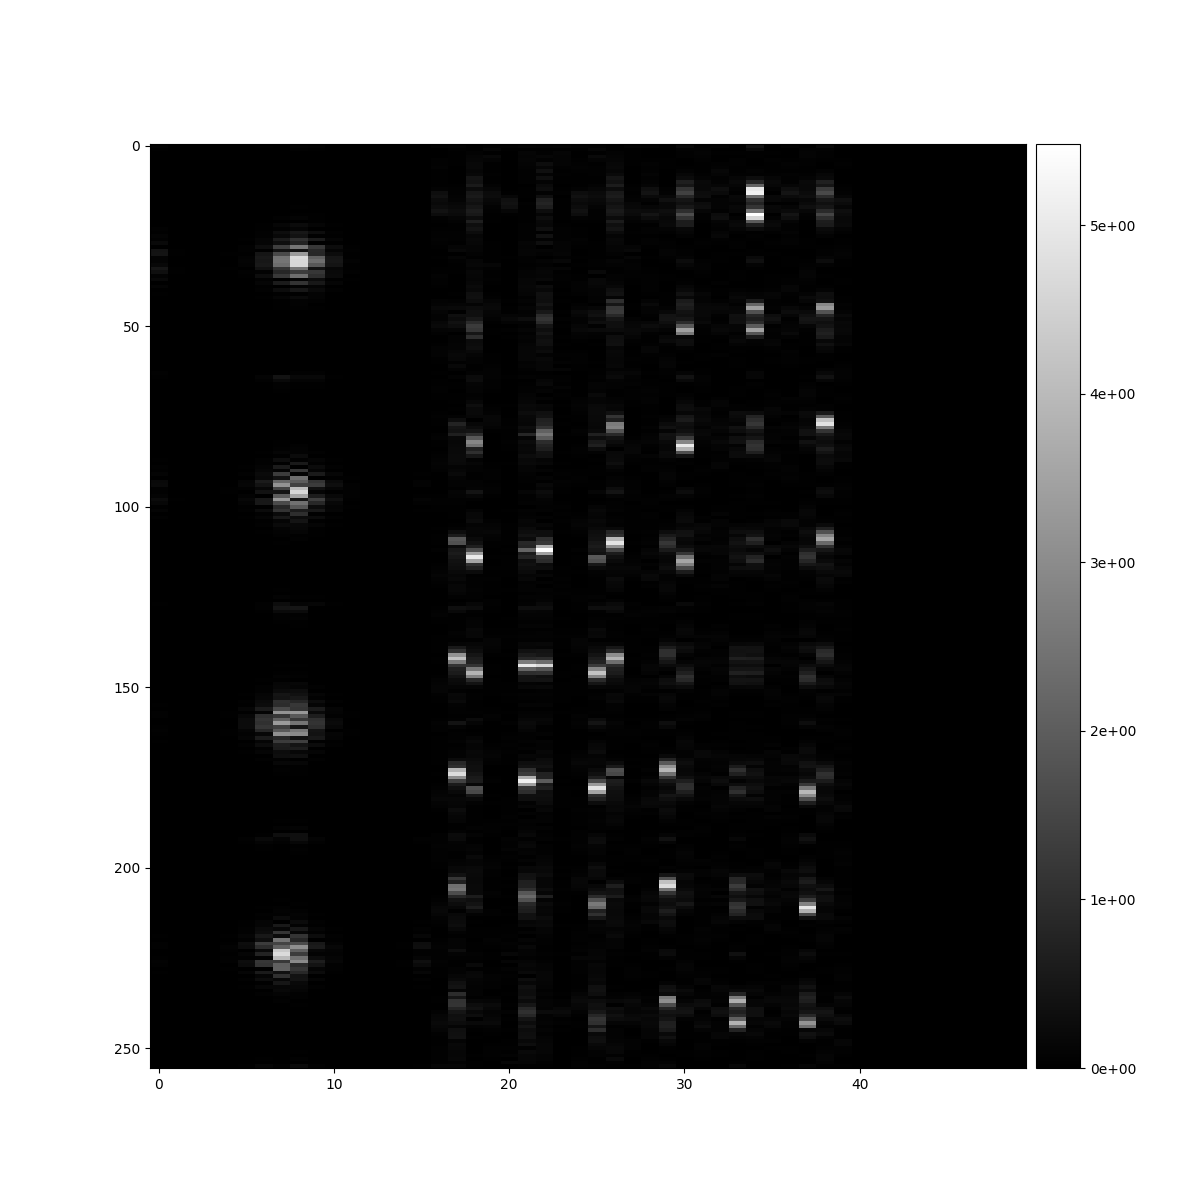
Curvelet Coefficients: Concatenated
# coeffs_vec = C.vect(coeffs=coeffs)
# coeffs_img = []
# for i in range(0, len(coeffs_vec) - zone_plate.size, zone_plate.size):
#     coeffs_img.append(coeffs_vec[i : i + zone_plate.size].reshape(1, *zone_plate.shape))
# if len(coeffs_vec) % zone_plate.size != 0:
#     coeffs_img.append(np.zeros((1, *zone_plate.shape), dtype=coeffs_vec.dtype))
#     coeffs_img[-1].flat[
#         len(coeffs_vec) - zone_plate.size : len(coeffs_vec)
#     ] = coeffs_vec[len(coeffs_vec) - zone_plate.size :]
# coeffs_img = np.concatenate(coeffs_img, axis=0)

_coeffs_vec = []
for c in coeffs[:2]:
    for d in c:
        for a in d:
            _coeffs_vec.append(a.ravel())
coeffs_vec = np.concatenate(_coeffs_vec)

coeffs_img = np.zeros((1, *zone_plate.shape), dtype=coeffs_vec.dtype)
coeffs_img.flat[: len(coeffs_vec)] = coeffs_vec[: len(coeffs_vec)]
fig, ax = plt.subplots(figsize=(12, 12))
opts["vmax"] = np.abs(coeffs_vec).max()
opts["vmin"] = 0
opts["cmap"] = "gray"
opts["aspect"] = "auto"
im = ax.imshow(np.abs(np.concatenate(coeffs_img, axis=0))[:50, :].T, **opts)
_, cb = create_colorbar(im=im, ax=ax)
fmt = ticker.FuncFormatter(lambda x, _: f"{x:.0e}")
cb.ax.yaxis.set_major_formatter(fmt)
Total running time of the script: (0 minutes 8.137 seconds)