Note
Go to the end to download the full example code.
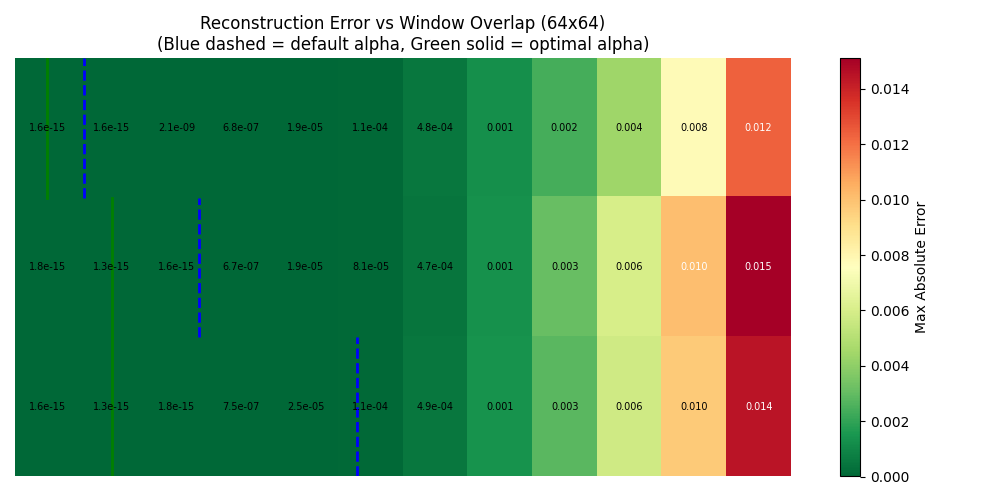
Window Overlap (Alpha) Heatmap
This example visualizes reconstruction error as a function of window_overlap for different UDCT configurations.
The heatmap displays:
X-axis: window_overlap values
Y-axis: wedges_per_direction
Color: reconstruction error
Blue dashed line: default alpha (10% of theoretical max)
Green solid line: optimal alpha (minimum reconstruction error)
The default window_overlap is computed using the Nguyen & Chauris (2010) constraint:
where \(s\) is the scale index, \(N\) is the number of wedges, and \(\alpha\) is the window_overlap parameter.
The default uses 10% of the theoretical maximum, while the optimal is determined empirically from the reconstruction error.
from __future__ import annotations
import matplotlib.pyplot as plt
import numpy as np

from curvelets.numpy import UDCT
from curvelets.plot import despine
Compute Alpha Values
Define functions to compute the theoretical maximum and default window_overlap using the Nguyen & Chauris (2010) constraint formula.
def compute_theoretical_max(num_scales: int, wedges_per_direction: int) -> float:
    """
    Compute the theoretical maximum window_overlap from Nguyen & Chauris constraint.

    Parameters
    ----------
    num_scales : int
        Number of scales in the transform.
    wedges_per_direction : int
        Number of wedges per direction at the coarsest scale.

    Returns
    -------
    float
        Theoretical maximum window_overlap value.
    """
    wedges_per_scale = (wedges_per_direction * 2 ** np.arange(num_scales - 1)).astype(
        int
    )

    min_overlap = float("inf")
    for scale_idx, num_wedges in enumerate(wedges_per_scale, start=1):
        k = 2 ** (scale_idx / num_wedges)
        discriminant = 1 + 8 * num_wedges / k
        a_max = (-3 + np.sqrt(discriminant)) / 4
        min_overlap = min(min_overlap, a_max)

    return min_overlap


def compute_default_alpha(num_scales: int, wedges_per_direction: int) -> float:
    """
    Compute default window_overlap (10% of theoretical maximum).

    Parameters
    ----------
    num_scales : int
        Number of scales in the transform.
    wedges_per_direction : int
        Number of wedges per direction at the coarsest scale.

    Returns
    -------
    float
        Default window_overlap value (10% of theoretical maximum).
    """
    return 0.1 * compute_theoretical_max(num_scales, wedges_per_direction)
Heatmap: Error vs Window Overlap
Create a heatmap showing reconstruction error as a function of window_overlap for a 64x64 image.
Blue dashed lines mark the default alpha (10% of theoretical max)
Green solid lines mark the optimal alpha (minimum error)
Only alpha values below the theoretical maximum are tested to ensure valid configurations.
# Configuration
shape = (64, 64)
wedges_range = [3, 6, 12]  # Must be divisible by 3
num_scales = 3
n_alpha_steps = 12  # Number of alpha values to test per row

# Compute theoretical max for each wpd (use minimum across all wpd for grid)
theoretical_maxes = [compute_theoretical_max(num_scales, wpd) for wpd in wedges_range]
min_theoretical_max = min(theoretical_maxes)

# Alpha range stays below the critical limit for all configurations
alpha_range = np.linspace(0.02, 0.95 * min_theoretical_max, n_alpha_steps)

# Generate test data
rng = np.random.default_rng(42)
test_data = rng.standard_normal(shape)

# Compute error matrix
error_matrix = np.zeros((len(wedges_range), len(alpha_range)))
default_alphas = []

for i, wpd in enumerate(wedges_range):
    default_alpha = compute_default_alpha(num_scales, wpd)
    default_alphas.append(default_alpha)

    for j, alpha in enumerate(alpha_range):
        transform = UDCT(
            shape=shape,
            num_scales=num_scales,
            wedges_per_direction=wpd,
            window_overlap=alpha,
        )
        coeffs = transform.forward(test_data)
        recon = transform.backward(coeffs)
        error_matrix[i, j] = np.max(np.abs(test_data - recon))

# Find optimal alpha (minimum error) for each row
optimal_alphas = []
for i in range(len(wedges_range)):
    min_idx = np.argmin(error_matrix[i, :])
    optimal_alphas.append(alpha_range[min_idx])
Plot Heatmap
fig, ax = plt.subplots(figsize=(10, 5))

# Plot heatmap with green=low error, red=high error
im = ax.imshow(error_matrix, cmap="RdYlGn_r", aspect="auto")

# Add text annotations to each cell
for i in range(len(wedges_range)):
    for j in range(len(alpha_range)):
        error_val = error_matrix[i, j]
        # Format as scientific notation for small values
        label = f"{error_val:.1e}" if error_val < 0.001 else f"{error_val:.3f}"
        # Choose text color based on background brightness
        text_color = "white" if error_val > 0.01 else "black"
        ax.text(j, i, label, ha="center", va="center", color=text_color, fontsize=7)

# Mark default alpha (blue dashed) and optimal alpha (green solid) for each row
for i, (def_alpha, opt_alpha) in enumerate(zip(default_alphas, optimal_alphas)):
    # Default alpha (blue dashed)
    x_pos_def = np.interp(def_alpha, alpha_range, range(len(alpha_range)))
    ax.axvline(
        x=x_pos_def,
        ymin=(len(wedges_range) - 1 - i) / len(wedges_range),
        ymax=(len(wedges_range) - i) / len(wedges_range),
        color="blue",
        linewidth=2,
        linestyle="--",
    )

    # Optimal alpha (green solid)
    x_pos_opt = np.interp(opt_alpha, alpha_range, range(len(alpha_range)))
    ax.axvline(
        x=x_pos_opt,
        ymin=(len(wedges_range) - 1 - i) / len(wedges_range),
        ymax=(len(wedges_range) - i) / len(wedges_range),
        color="green",
        linewidth=2,
        linestyle="-",
    )

# Labels
ax.set_xticks(range(len(alpha_range)))
ax.set_xticklabels([f"{a:.2f}" for a in alpha_range], fontsize=7, rotation=45)
ax.set_yticks(range(len(wedges_range)))
ax.set_yticklabels(wedges_range)
ax.set_xlabel("Window Overlap (alpha)", fontsize=11)
ax.set_ylabel("Wedges per Direction", fontsize=11)
ax.set_title(
    "Reconstruction Error vs Window Overlap (64x64)\n"
    "(Blue dashed = default alpha, Green solid = optimal alpha)"
)
despine(ax)

# Colorbar
cbar = plt.colorbar(im, ax=ax)
cbar.set_label("Max Absolute Error")

plt.tight_layout()
plt.show()
Interpretation
The heatmap shows several key patterns:
Green regions (low error) indicate good reconstruction quality. These typically occur at lower window_overlap values.
Red/Yellow regions (high error) indicate poor reconstruction. These typically occur at higher window_overlap values.
Blue dashed lines mark the default alpha values using 10% of the Nguyen & Chauris theoretical maximum.
Green solid lines mark the optimal alpha values that give the minimum reconstruction error for each configuration.
The optimal alpha increases with wedges_per_direction because more wedges provide a looser constraint on the window overlap.
Total running time of the script: (0 minutes 0.734 seconds)